

For lots of folks, one of the most recognized parables Jesus ever told was about camels and money. It comes from Matthew 19:23-24:
Then Jesus said to his disciples, “Truly I tell you, it is hard for someone who is rich to enter the kingdom of heaven. Again I tell you, it is easier for a camel to go through the eye of a needle than for someone who is rich to enter the kingdom of God.”
It may be one of the things that I write about the most — the relationship between income and religion is not straightforward. For instance in this post I wrote a few months ago, I looked a income, education and weekly religious attendance.
The group that is the most likely to attend services are not the poor, nor the wealthy. Instead, it’s people who are smack in the middle of the income distribution. This analysis points to the following conclusion: The people who are the most likely to attend services this weekend are those with college degrees making $60K-$100K. In other words, middle class professionals.
Yeah, it’s not as simple as saying, “Rich people go to church.” Or “poor people are filling the pews.” It’s really middle class folks that are the most likely to make it to a house of worship this weekend.
I wanted to take a deeper look at that though — the income part, at least. It was just something that was dangling in the back of my mind for the last couple of months and I needed to do some data work on income, specifically. So that’s what you are getting here: a deep dive into household income and religion. Let’s get to it.
Your tax-deductible gift helps our journalists report the truth and hold Christian leaders and organizations accountable. Give a gift of $30 or more to The Roys Report this month, and you will receive a copy of “Hurt and Healed by the Church” by Ryan George. To donate, haga clic aquí.
This is the religious composition of folks in three income brackets (less than $50K, $50K-$100K, and more than $100K) in both 2010 and 2022. I fully recognize that inflation is a thing, by the way. I spent a little bit of time adjusting the income figures for 2010 to the 2022 benchmark. Almost nothing substantively changed, and it makes the graphs less clear. So, just roll with this, please.
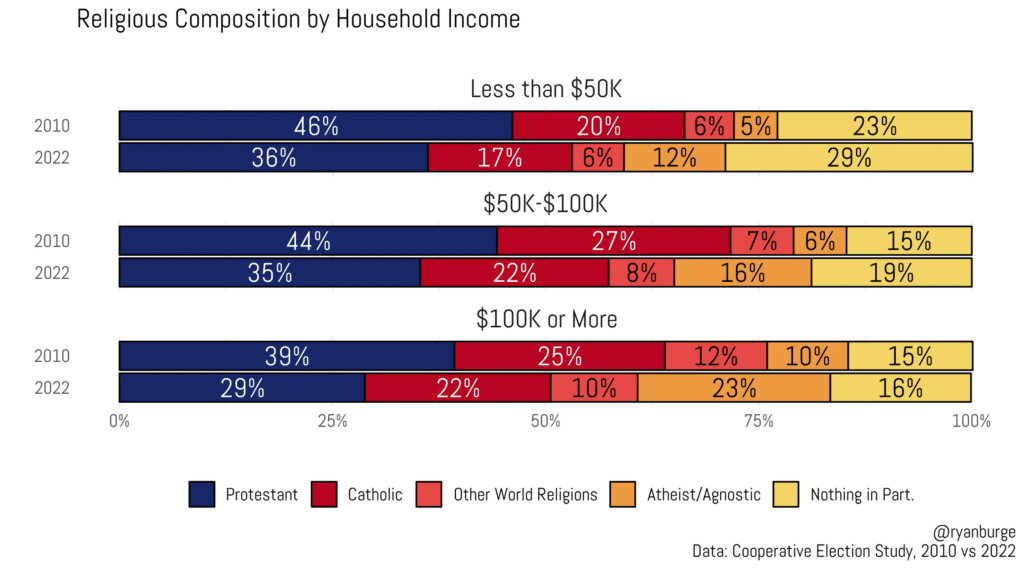
Protestants dropped 10 points in the low income group, nine points in the middle income group, and ten points in the high income group. Catholics dropped three points, five points and three points. You seeing a pattern here? Yeah, religion is declining at basically the same rate regardless of income.
But when you take a closer look at the nones, there are some patterns worth some careful consideration. Atheists/agnostics are up by seven points among the low income group, 10 points among the middle income group and 13 points among the high income group. Yeah, that’s a clear trend. A person making $100K+ is about twice as likely to be atheist/agnostic compared to someone making less than $50K.
Notice the difference in the nothing in particular category, too. It’s up six points, four points, and just one point among the top income earners in the sample. That’s absolutely something to keep in mind going forward. The nones have risen 13, 14 and 14 points respectively. It’s just the composition of those nones varies dramatically based on income.
Let’s throw education back into the mix now, using just three categories: high school or less, some college and a four year college degree or more. Again, using the same three levels of income employed in the prior graph. This is the share who were atheist, agnostic or nothing in particular in 2010 vs 2022.
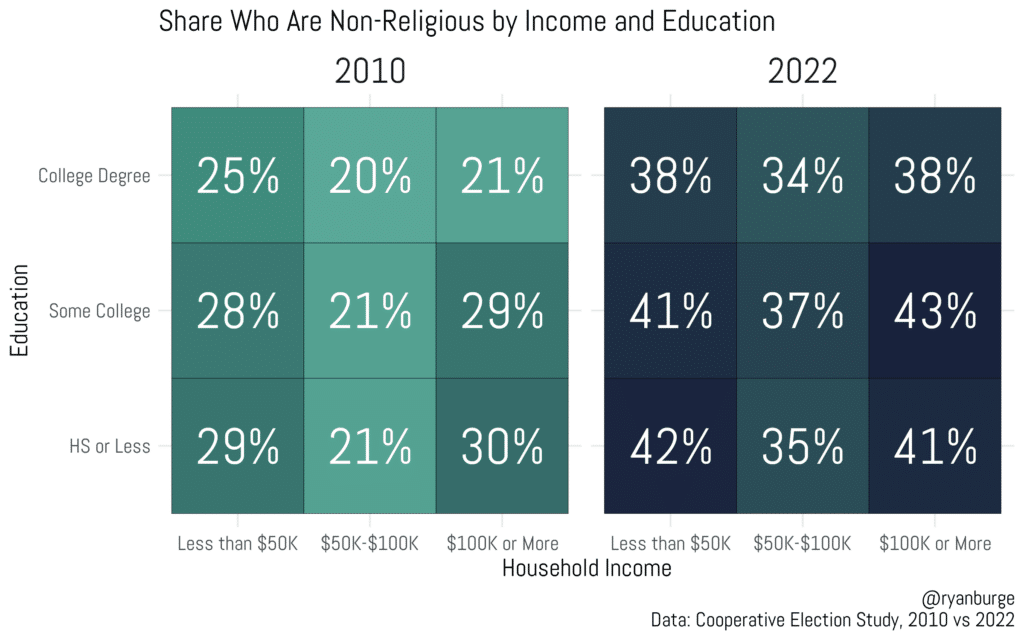
I want to point something out here: It’s the middle vertical column that is the real outlier. Compare those $50K-$100K folks to the income category below and above that. There’s a 7-9 point gap between the middle group and the others on either side in the 2010 data. In the 2022 results, that gap is still there, but it has narrowed a bit. It’s closer to 4-5 points when looking at the most recent survey results.
But let me put a really fine point on this. Which square has the lowest rate of nones in 2010 and in 2022? It’s the same mix: those with a college degree or more who make between $50K and $100K per year. It’s not the richest, nor is it the poorest. It’s those in the middle class. But they also have a college degree. That’s a key part of the formula.
For simplicity’s sake I just subtracted the nones share in 2022 from the same share in 2010 and made the heatmap below so you don’t have to do the math in your head.
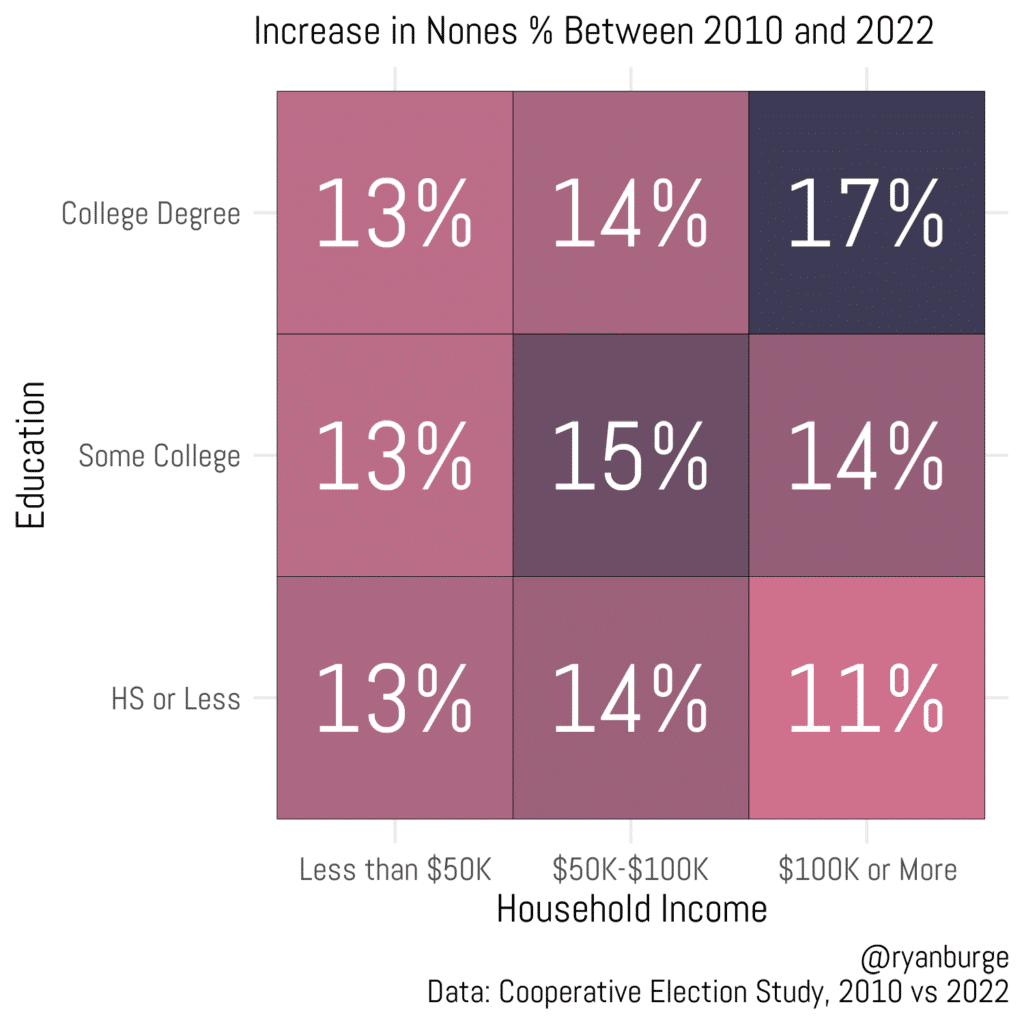
In what square have the nones risen the fastest? The top right, which are those with high levels of income and high levels of education. That’s up 17 percentage points. The group that indicates the slowest growth rate is the bottom right square: those who have a high school diploma or less and make at least $100K per year. Quite the contrast in the far right column.
The rest of the heatmap just doesn’t tell us a whole lot. Every number is between 13 and 15 percentage points of increase in the prior 12 years. I don’t think you can make much of that beyond the two squares I pointed out previously. The nones are rising at every level of education and income.
But let’s look at this another way using data from the Nationscape survey. This sample is over 477,000 respondents, so I break it down into individual income brackets across 15 different religious traditions. That’s exactly what I did below.
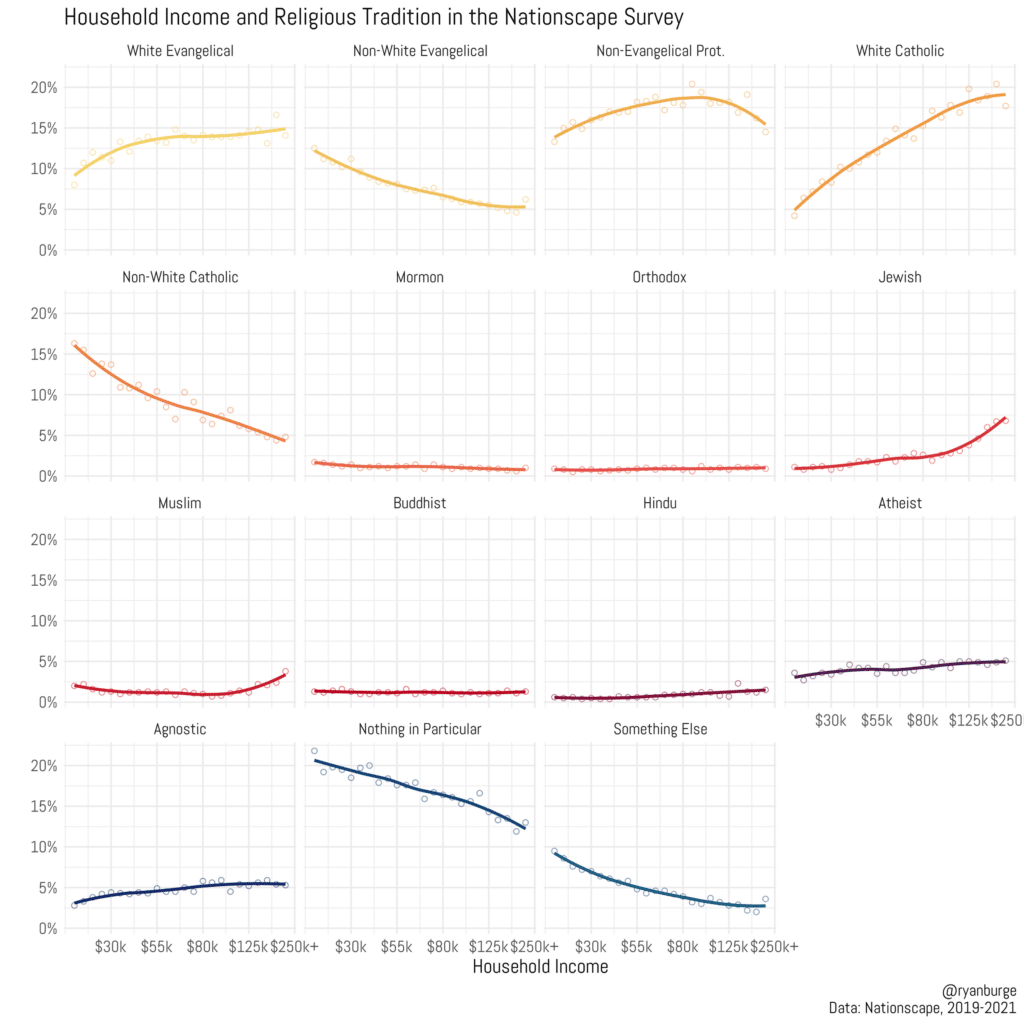
White evangelicals are a bit more scarce among the lowest income brackets, but they quickly rise to 14-15% and just stay there once you get to about $60K or more in household income. Non-White evangelicals are in the opposite direction: more prevalent among the lowest income folks and become less plentiful as incomes begin to rise. In fact, that same pattern is particularly striking among Catholics, too. Among respondents at the bottom end of the income spectrum, just 5% are White Catholic. It’s about 18% of those at the top end of the income distribution.
I did want to point out the nonevangelical Protestants, too. They exhibit a pretty curvilinear trend line. Among the poorest respondents, about 14% are nonevangelical Protestants. It’s about 15% among the highest earners. But the income level where this becomes the most pronounced is right about $100K per year — at 18%.
Both the Muslim and Jewish lines are noteworthy. Very flat through most of the income levels, until one gets to those making significant incomes. Then the trend lines shoot up for both groups among the highest earners. The same thing happens among Hindus, too, but it’s much less dramatic at the end.
For the nones, it’s clear that higher income folks are more likely to be atheists or agnostics, but it’s not a huge uptick. Among those making $250K or more a year, about 5% are atheist, and the same share are agnostic. The nothing in particular line is going the other direction, though. It’s a response option that is much more prevalent among those with the lowest incomes (~20%) than those with the highest incomes (~12%).
But, of course, religious tradition is just one piece of the equation. Actually attending church services may be even more important from a social science perspective. I wrote about that here.
So, I returned to the same basic setup from the first graph – three levels of income and comparing the results from 2010 and 2022.
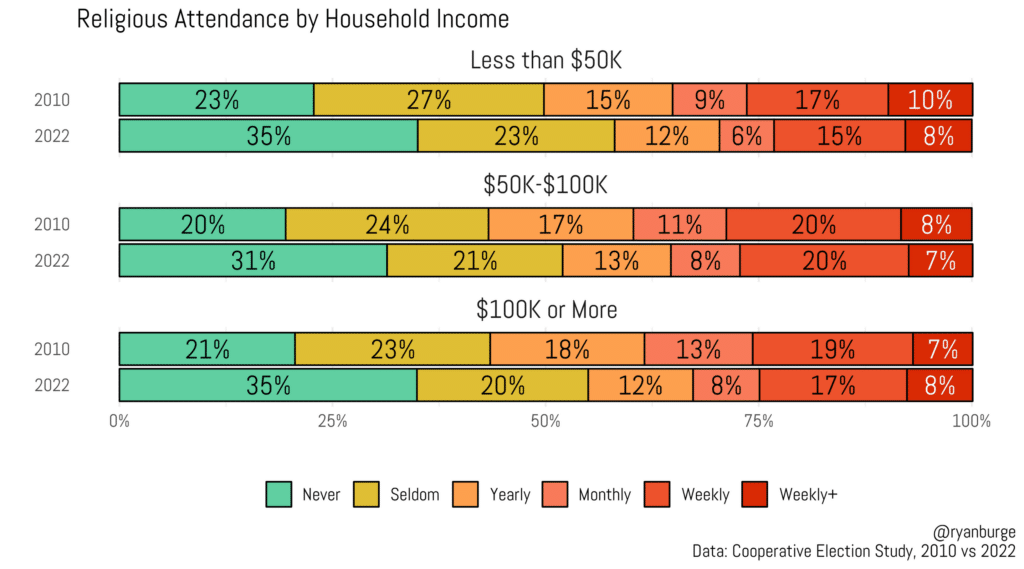
Here’s the increase in never/seldom attending by income level:
-
Less than $50K: +8
-
$50K-$100K: +8
-
$100K or More: +11
Okay, that’s clearly a big jump in the “less than once a year” category among Americans in the highest income bracket. But here’s what is really puzzling to me about all of this: The top end of the attendance spectrum is really unchanged.
-
Less than $50K: 27% to 23%
-
$50K-$100K: 28% to 27%
-
More than $100K: 26% to 25%
So, the income level that saw the biggest jump in the seldom/never bucket also reported almost no change in the weekly or more category. It’s really an odd thing happening here. I don’t know if I have some fully formed thoughts about it. But maybe some of you do.
Let’s end with a regression, though. I wanted to control for some other demographic factors that I think have some bearing on attendance: age, race, gender and political partisanship. I used the three categories of education that I constructed earlier but used the entire range of income values from both the 2010 and 2022 surveys.
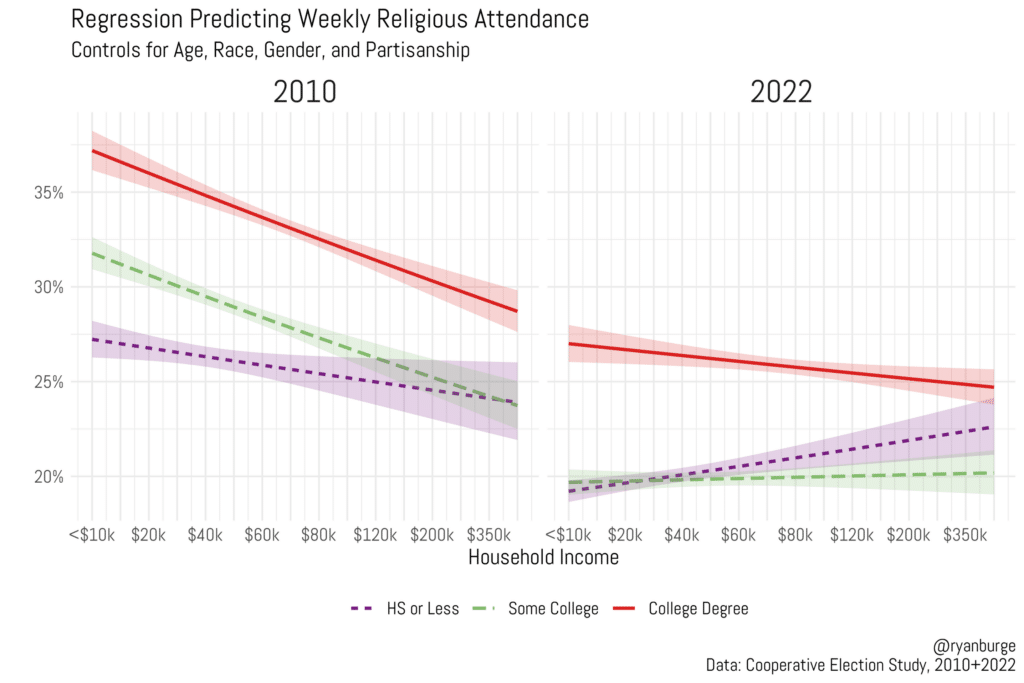
These survey results are really striking in how different they are in 2010 compared to 2022. In 2010, the direction of the lines is unmistakable: down. That means that as household incomes increase, the likelihood of attending religious services every week drops. Those drops are not that small either. Among those with a college degree, the dip in weekly attendance from the bottom end of the income spectrum to the top end is about eight percentage points. It’s about the same among those with some college. For those with a high school diploma or less the impact of income is more modest, with a three percentage point drop.
The 2022 results are just completely different compared to those from 2010. The lines clearly aren’t pointing downward at nearly the same rate. For instance, the drop in weekly attendance from the left to the right side is just two percentage points among those with a college degree. That is statistically significant but not substantively large.
For those with some college education, the trend line is completely flat. That means that income has zero impact on religious attendance. Definitely a big change from the 2010 results. For those at the lowest end of the education spectrum, an increased income actually results in a higher likelihood of attending religious services. It’s a modest increase: less than three percentage points. But it’s statistically significant.
Something happened in the last decade or so when it comes to religious attendance and household income. That’s very apparent to me from these regression results. It used to be a negative relationship. Now it’s likely no relationship in the aggregate, with a little variation based on education.
But here’s something I haven’t mentioned to this point — look at the red line in the 2022 graph for college educated folks. They attend religious services at higher rates than those with less education, regardless of income. That was also the case among college educated respondents in 2010, as well.
I am going to keep working at this, by the way. I don’t think I have a fully formed understanding of the interaction between income, education and religiosity (in its various forms). I am thinking that there has to be a racial aspect I’m missing. Or something to do with generations. Or maybe age.
Rest assured — I don’t think that I will ever run out of questions to answer when it comes to income, education and religion.
The views expressed in this commentary, which was originally published at Ryan Burge’s “Graphs About Religion”, no reflejan necesariamente los de The Roys Report.
 Ryan Burge es profesor asistente de ciencias políticas en la Universidad del Este de Illinois, pastor de la Iglesia Bautista Estadounidense y autor de “Los nones: de dónde vienen, quiénes son y hacia dónde van.”


Una respuesta
Wasn’t “High church attendance among Middle Class” also a pattern among Victorians?
And/or the Godly Golden Age of the Nifty Fifties when “everyone went to church”?