

Our understanding of religion is a series of best guesses.
In doing a lot of interviews for my first book about religious “nones” — those who do not identify with any particular religion — I quickly understood that I was going to be asked very similar questions by reporters and podcast hosts. I developed some pretty standard answers to many of them. But there was one question I soon learned to dread that came up the most frequently during these interviews: What percentage of Americans have no religious affiliation?
Often that question is followed up by the host or reporter noting that in various outlets on the internet I have given completely different answers to that question. After emitting a slightly embarrassed laugh, I would have to come clean: There’s no right answer to that question. I can completely understand why that would not be a satisfactory response for many in the audience — they want a simple, easily remembered percentage. To be honest, I do too. But, unfortunately, there’s just not a single answer to a question like how many nones are there? Or how many Christians?
Being in a doctoral program is like trying to drink from a fire hose — the first year is just trying your best to not drown. But, after overcoming that steep learning curve, I was hit by another shock that I still wrestle with to this day: A lot of how we approach surveys is a series of best guesses. Many times in a graduate seminar, there will be four or five readings that will trace the debate in the literature about how to define a concept or how to measure it in the best way. For instance, many political scientists are interested in assessing how much the average American knows about politics, but no one can agree on the right questions to ask to actually measure the concept of political knowledge. Any time a researcher proposes a battery of knowledge questions, there’s a chorus of academics declaring that they are too easy or too hard. Even today, there’s no well-accepted political knowledge battery. I spend an entire week in my research methods course talking about how to define and quantify racist attitudes. I’ve taught that course at least a half-dozen times, and I feel more pessimistic each time that we will ever discover a good way to measure such a slippery concept.
I think I always just assumed that survey questions were developed only after a team of very smart social scientists had formed an unimpeachable understanding of how folks think about religion, politics and society, and then they put together a series of questions. Instead, surveys consist of a collection of questions and response options that could be generously described as “cobbled together.” What I mean by that is that some of the most important and long running surveys in American social science try to measure the same concept in completely different ways. Thus, there’s no single answer to seemingly simple questions about the size and composition of religious or political groups in the United States. Put simply, there are many “right” answers to basic questions that the public has about American society.
Your tax-deductible gift helps our journalists report the truth and hold Christian leaders and organizations accountable. Give a gift of $30 or more to The Roys Report this month, and you will receive a copy of “Hurt and Healed by the Church” by Ryan George. To donate, click here.
To fully understand this quandary requires a quick detour into the nuts and bolts of how academics conduct surveys. Our goal is to accurately describe what Americans think and how they feel about policing, abortion, religion or any number of topics. But to do that we need to survey a sample that accurately represents what the country looks like. Life would be a lot simpler and cheaper for social scientists if we had the ability to just grab a random sample of people living inside the United States. Here’s the problem, though: Randomly contacting 1,000 people whose gender, education and partisanship accurately match the country as whole is just not a realistic possibility.
However, we’ve developed a system to help us correct for the fact that our random sample will never be truly random. What we do is generate a survey weight, which is essentially a way to allow certain respondents in our survey to count for more (or less) when we do the actual analysis. For instance, if I surveyed 1,000 respondents and 600 were women and only 400 were men, I’ve got an issue. To fix that gender imbalance, I would employ a weight that would make each male respondent count for slightly more than one person and every woman count for slightly less. Usually, we weight for four or five major characteristics that tend to be problematic. Those with higher levels of education or income are typically overrepresented in a random sample, so we need to weight them down. Older people tend to be less inclined to take online surveys, so we need to weight them up. While we can never correct for the imbalances of a nonrepresentative survey sample, we can get fairly close by adding weights to our data set.
For gender, it’s pretty easy to figure out how to generate a weight: There should be the same number of women and men. But how do we do it for something like education? We often turn to data provided by the United States Census Bureau. The tremendous benefit in using this data is the Census Bureau doesn’t use a random sample. They literally count every single person in the United States; that’s its constitutional duty. The census has become the benchmark that we can weight against, and it leads to much more representative survey results.
However, there’s a problem. While the Census Bureau can tell us what the age, education or income distribution should look like in a random sample, they cannot tell us anything about the religious composition of the United States. Never in its history has the bureau included a religious tradition question on its decennial census. For approximately 50 years in the early 20th century, the Census of Religious Bodies was conducted by the Bureau, but clergy were asked to report about their congregations, not individual members. That effort fizzled out in the mid-1950s, and by 1976 Congress passed a law that prohibited the Census from including any mandatory question about a respondent’s “religious beliefs or to membership in a religious body.” Thus, even if we wanted to weight our survey data against some type of “gold standard” source on religion, one does not exist to make that a reality.
What we are left with is a variety of surveys that ask a wide array of questions about Americans’ religious attachments, religious behavior and beliefs about God in completely different ways that make comparisons nearly impossible. And the implications for social scientists, pastors and an interested lay audience are tremendous. Many of the most important shifts in American society are subtle and take years or even decades to build to a critical mass. Surveys have always been a good way to catch those trends early and possibly react to them. For instance, if data indicates that lots of young women are leaving churches, denominational leaders and pastors can begin to develop a plan to reverse that trend — but if the surveys are faulty, they are merely tilting at windmills.
Consider a recent finding by the Gallup Organization that was published with the headline “U.S. Church Membership Falls Below Majority for First Time.” The team at Gallup is one of the most recognizable names in American religion polling, having conducted surveys for longer than any firm in the United States. They began asking, “Do you happen to be a member of a church, synagogue or mosque?” in the mid-1930s. For decades, the number who responded “yes” hovered around 75 percent, until it began to decline significantly around 2000. By 2005, it was 65 percent, and then it dropped ten percentage points in just a decade. And, as the headline describes, in 2020 that number reached 47 percent.
Obviously, this turned a lot of heads in the media world, and a spate of stories were written about the decline of religion in the United States. But my first reaction was a bit more measured. I am not entirely sure the conclusion that “religion has dropped dramatically in the last 20 years” is really reflected in that data. Remember that the question asks specifically about church membership—not attendance or affiliation. What makes that problematic is that many of the fastest growing churches in the Protestant tradition are non-denominational and do not place a high value on becoming a church member. In fact, many of them do not even keep a membership record. Thus, this measure is tapping into only one dimension of American religion, and that may not be the most accurate one.
But this latest Gallup report is not the only instance in which questions about religion can lead to results that differ widely from one another. Let’s take a very basic one: “What share of the adult population of the United States would be defined as religiously unaffiliated?” It’s a question that, on the surface, seems to be easy enough to answer. But instead, it exposes a number of issues with survey design and response options.
Let’s compare how two of the most widely used surveys in the social sciences, the General Social Survey (GSS) and Cooperative Election Study (CES), ask the same basic question. Beginning in 1972, the GSS asked respondents, “What is your religious preference? Is it Protestant, Catholic, Jewish, some other religion, or no religion?” Based on a person’s answer to this question, they may be asked more questions to drill down on what type of Protestant they are, but if they respond “no religion,” they are moved on to another part of the survey. They aren’t asked, for instance, if they specifically identify as an atheist or agnostic.
On the other hand, the CCES asks, “What is your present religion, if any?” Then they are presented with 12 different response options: Protestant, Catholic, Mormon, Orthodox, Jewish, Muslim, Buddhist, Hindu, Atheist, Agnostic, Nothing in Particular, or Something Else. Based on respondents’ selection, they are funneled through a series of additional questions that help determine what type of Judaism they are affiliated with or if they are a Sunni or Shia Muslim.
If our task is to measure the share of Americans who have no religious affiliation, can you see the issue that we encounter when comparing these two survey approaches? The GSS essentially offers one option for a none: no religion. The CCES, on the other hand, provides three choices: atheist, agnostic or nothing in particular. The result of these two approaches is that dramatically different shares of Americans are found to have no religious affiliation.
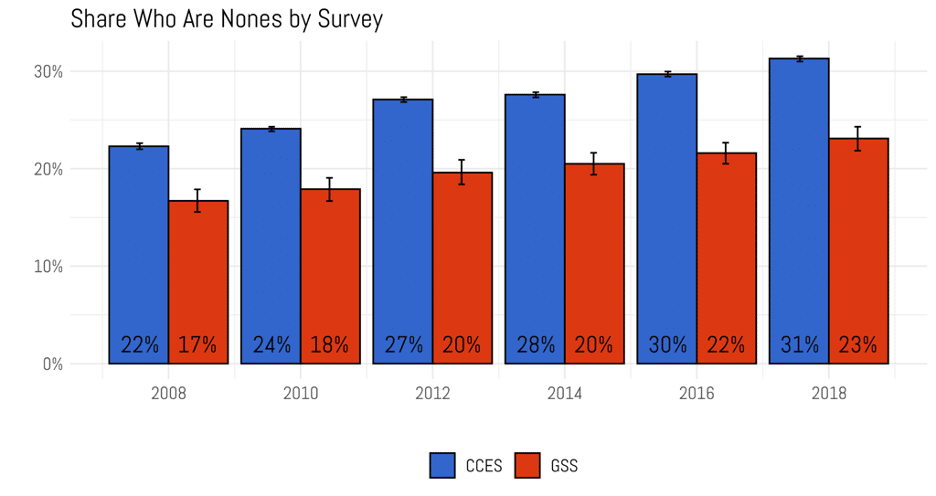
In 2008, 17 percent of the GSS sample had no religious affiliation compared to 22 percent of those taking the CCES. However, those 2008 figures represent the smallest gap between the two surveys. From that point forward the gap widens incrementally every two years. By the 2016 and 2018 survey waves, that gap is a total of eight percentage points. In the 2018 data, 31 percent of the CCES sample can be classified as a religious none; it’s just 23 percent of those in the GSS.
But just speaking in percentages obscures how practically different these two estimates truly are. According to the United States Census Bureau, there are 210 million adults in the United States. If the GSS number is accurate, that means just over 48 million Americans have no religious affiliation. If the CCES number is the more accurate one, then 65 million Americans do not attach themselves to a religious tradition. That difference is about 17 million adults, which is slightly smaller than the population of the state of New York.
However, I am not entirely convinced that survey response options are the only reason the estimates from these two surveys diverge so significantly. Instead, there may be something going on that those who deal with survey research are constantly struggling with: social desirability bias. That is, survey respondents tend to answer questions in ways that are not factually accurate, but instead that they believe are the more “proper” response. While a lot about social desirability bias is unknowable, there’s ample evidence that the pressure to lie is heightened when the survey is conducted face to face and is significantly diminished when the survey is administered through an online web browser. For example, imagine you were asked to take a survey in which the administrator sits across the table from you and asks if you masturbate, if you’ve ever done drugs, if you have cheated on your spouse, or if you think that women are just as qualified to be leaders as men. In each of these cases, there’s plenty of reason to believe that the responses offered will not accurately reflect the thoughts and feelings of those taking the survey.
In much the same way that questions about sexual behavior or views of race or gender are shot through with social desirability bias, so are questions related to religious affiliation and behavior. When a survey administrator asks how often someone goes to church, the person responding knows that the survey company has no way to verify if they are lying or not. So, many survey participants inflate their worship attendance.
Because the GSS began decades before widespread internet usage, it began its administration using a face-to-face format, and for consistency has kept that approach throughout its entire 46-year history. The CCES, however, began just 15 years ago, when most Americans had access to the internet and therefore has always been conducted online. Even if both surveys asked the same question with the same response options, it’s reasonable to assume that there would be more nones in the CCES than the GSS based solely on survey mode.
It’s obviously impossible to go back to survey respondents after the fact and ask them, “Were you lying when we asked you those questions earlier?” To put it bluntly, they are going to lie about not lying. Thus, social desirability bias is an incredibly difficult problem to overcome for survey researchers. However, there are ways to make an educated guess about the level of bias in our sample. For instance, if people taking the GSS were really religiously unaffiliated but were afraid to mention that to another person, it seems plausible that they would indicate they were Christians but they never went to church. Because the CCES is conducted online, if someone was a marginally attached Catholic or Protestant and never attended, it seems likely that they would check the box next to something like “nothing in particular” instead of saying that they were a Christian.
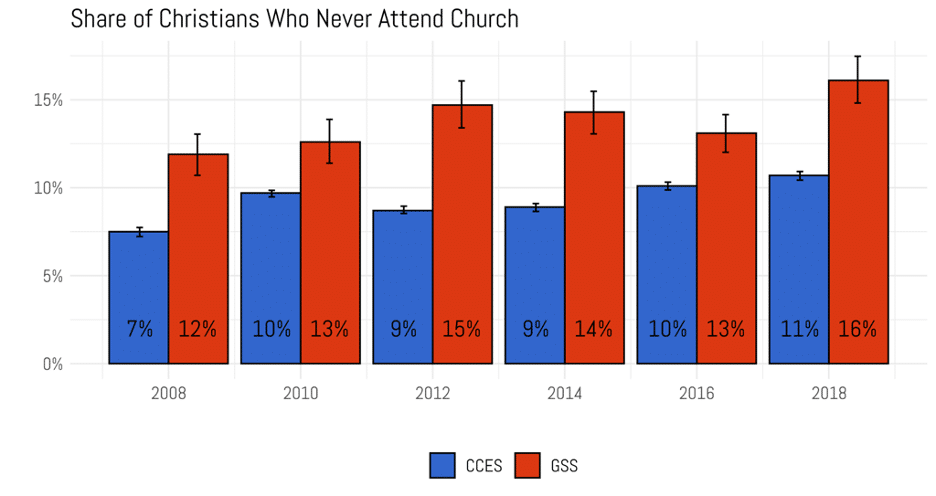
This is exactly what we find when comparing the shares of Catholics or Protestants who never attend church services in the CCES versus the GSS. Across all six survey waves, the share of Christians who indicate no church attendance is higher in the GSS than the CCES. In many years, the difference is five percentage points or more. Recall that the gap between the estimates of the nones was about eight percentage points in later years in these two surveys. If those never attending Christians in the GSS would have instead reported no religious affiliation, the disparity in the estimates of the nones would be narrowed significantly between these two instruments.
Conclusions
In the wake of both of the 2016 and 2020 presidential elections there was an outcry among the American public about the failings of the polling industry. There was reason for anger, as the polls predicted that the Democratic candidate would prevail easily over Donald Trump. In both instances, the polls results did not match the vote tallies on election day. Critics were quick to point out the failure of the polling industry and noted the potentially misleading impression they gave to the American public about the state of the presidential race.
In the wake of each polling miss, election forecasters inevitably write a series of postmortems about why the polls were off so much and how they need to be improved before the next election cycle. Often these reports involve highly technical details that the average American glosses over, looking for a simple explanation for why they cannot field a better survey. In addition to the most visible members of the polling industry, plenty of very smart people who are members of the American Association for Public Opinion Research devote their lives to getting this right and are mortified when the polls don’t match the reality on election day. No one who does this work for a living wants to report a poll that they know is misleading, but diagnosing the problems with modern polling and coming up with solutions is incredibly complicated.
But I have a much simpler response to all the criticism that has been lobbed at the polling industry over the last few years: if we got rid of public opinion polls, what would we replace them with? Imagine, for a minute, that the United States conducted a presidential election in 2024 but banned the use of public opinion polls entirely in the runup to November. Would we be better off as a country if there were no way to assess whether the race was a dead heat or looked like a landslide? Would the hundreds of journalists tasked with covering the election do a better job of picking stories if they didn’t know whether the race was particularly tight in one state or another?
I think we can all readily admit that polls are not perfect, but they are orders of magnitude better than the alternative of just randomly guessing who was going to win the election based on our own personal encounters with people in our daily lives. There’s a famous (now debunked) anecdote about the film critic Pauline Kael who lived in New York City surrounded by Democrats. She infamously reflected on the outcome of the 1972 presidential election by stating, “Nixon couldn’t have won because I don’t know anyone who voted for him.”
I think we’ve all had that thought from time to time on election day. Every single one of us lives in our own bubble. Liberal people tend to live in urban and suburban areas surrounded by a more progressive friend group, and conservatives congregate in their own enclaves in rural parts of the country. Thus, for most of us, our perception of how people will vote is fatally flawed. Polls are really the only cure we have for our own political myopia.
However, that’s not to say polls are perfect instruments well calibrated to accurately describe the American public in political, social and religious detail. As I’ve outlined in this chapter, measuring religion is incredibly problematic. But just because something is hard does not mean it’s not worth doing. In fact, for many of us who are quantitative social scientists, the challenges are what drive us to do this work. We all hope that the fruits of our labors are a more accurate picture of the opinions and behaviors of our fellow citizens.
The views expressed in this commentary, which was originally published at Religion Unplugged, do not necessarily reflect those of The Roys Report.
For more from Ryan Burge, read his latest book “20 Myths About Religion and Politics in America”.
 Ryan Burge is an assistant professor of political science at Eastern Illinois University, a pastor in the American Baptist Church and author of “The Nones: Where They Came From, Who They Are, and Where They Are Going.”


One Response
While I don’t know the exact questions that are asked on those surveys, if they’re like ones I’ve participated in they don’t ask things pertaining to a person’s faith. Religion and faith don’t necessarily mean the same thing anymore. For instance, I haven’t been to “church” in well over two years but in that time my faith in God has grown and I meet with others who’ve essentially given up “church” and are meeting with others who have done the same. I reference going to church as in belonging to a particular denomination. The questions and answers on those surveys more than likely aren’t reflecting this trend which seems to be growing in direct response to traditional religious bodies becoming irrelevant due to corruption, having failed business models, abandoning sacred tenets, etc.